
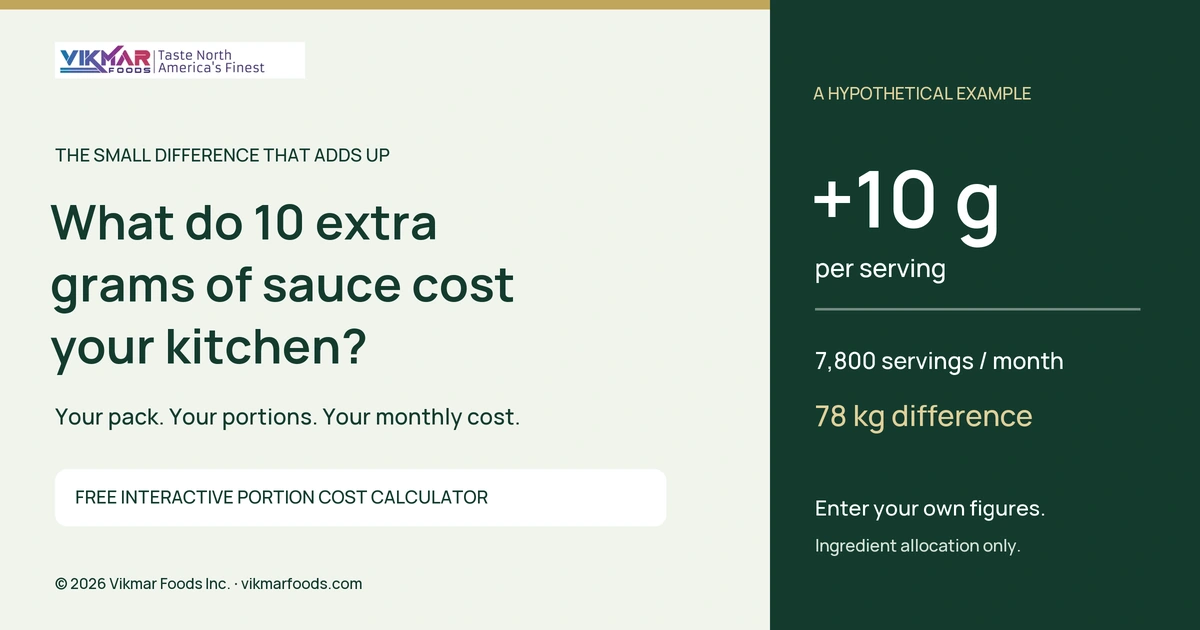
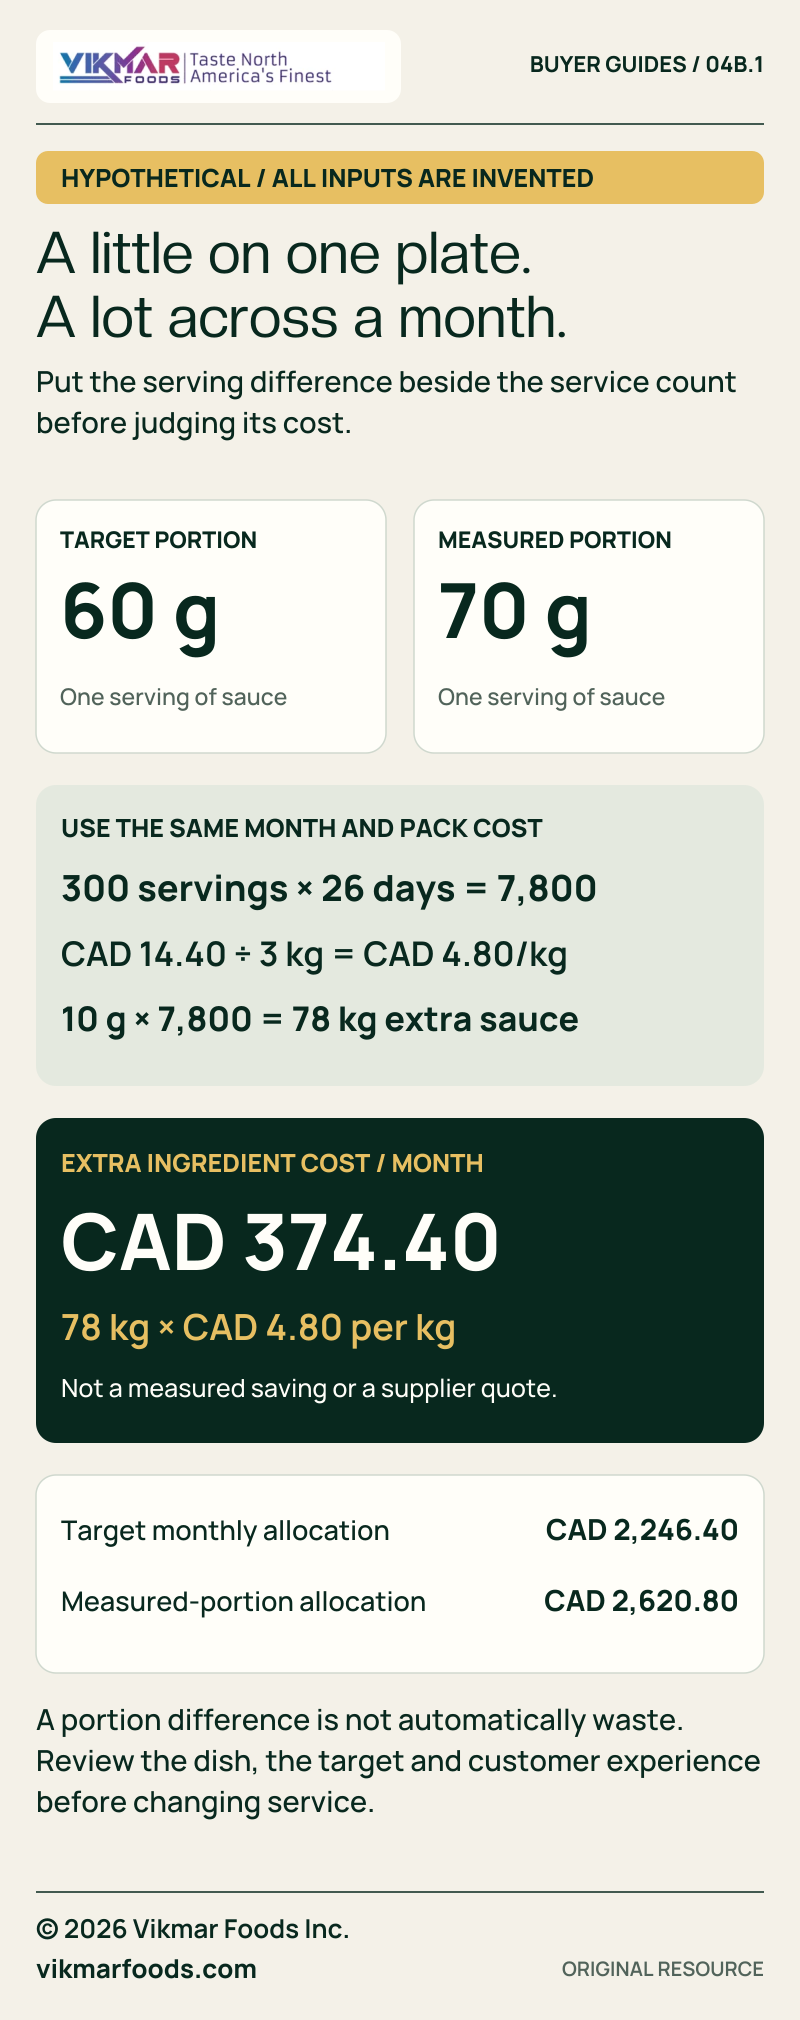
Ten grams is easy to overlook. Consider a hypothetical kitchen serving 300 portions a day for 26 days, where the sauce portion averages 70 grams against an approved target of 60 grams. That small difference adds up to 78 kilograms of sauce over the month.
Now give the sauce a hypothetical cost. If a pack costs CAD 14.40 and provides 3 kilograms of usable sauce, the additional ingredient allocation is CAD 374.40 for the month. That is a calculation from invented inputs, not a measured restaurant result, a Vikmar quotation or a promised saving.
Your numbers will tell a different story. The useful question is whether a difference you barely notice on one plate deserves attention across a whole service month. You can investigate that without cutting a portion, changing your recipe or deciding that every extra gram was wasted.
Put your own portion on the scale
Start with the serving you actually intend. Your target belongs to your approved recipe or service standard. This guide does not choose a nutritionally appropriate, safe or commercially suitable portion for you; it helps put an ingredient cost against a measured difference.
Use a consistent weighing method for comparison. Tare the plate or container, measure the sauce under normal service conditions and record the amount, product and context. A practical first check might cover several portions across more than one service, with the count and range recorded alongside the average. That is a suggested internal check, not a statistically validated sampling plan.
Keep the measurement tied to one sauce. A ladle's volume marking does not establish the weight of every sauce it holds. Avoid converting millilitres to grams without suitable product-specific information. This calculator accepts usable pack weight in kilograms and portion weight in grams, with the exact conversion of 1 kilogram to 1,000 grams.
Do not hide variation inside an average. If one service uses 55 grams and another uses 85, the same overall average could obscure very different working conditions. Record which dish was served, what utensil or dispenser was used and whether an extra portion was intentionally requested. The calculation becomes more useful when the measurement has an explanation.
Try the portion creep calculator
The tool compares two serving weights using the same sauce cost and service count. Enter your measured usable product per pack, its allocated ingredient cost, the approved target and the observed average. Then add servings per operating day and the number of operating days in your planning month.
The portion creep calculator
Compare the portion you intend to serve with the amount you actually measure. See the ingredient-cost difference over one month.
One sauce · One pack cost · Your approved target. Use usable product weight; no density or currency conversion is assumed.
Your portion-cost picture
Awaiting calculation- Monthly ingredient-cost difference
- —
- Difference per serving
- —
- Servings this month
- —
- Difference in sauce use
- —
Enter your values, or load the clearly hypothetical 10 g example.
See the cost breakdown
- Cost per target portion
- —
- Cost per measured portion
- —
- Portion difference vs target
- —
- Complete target portions / pack
- —
- Complete measured portions / pack
- —
Ingredient allocation only. This does not set a safe or suitable serving size, measure all food waste, or forecast whole-pack purchases. Below target is not automatically better.
How the calculation works
Usable grams = usable kg per pack × 1,000. Ingredient cost per gram = pack cost ÷ usable grams. Monthly cost difference = (measured grams − target grams) × servings/day × operating days × cost/gram. Each monthly cost uses the same pack and service count. No intermediate rounding; displayed money rounds to cents, per-portion costs to four decimals.
Complete portions per pack round down. Unused remainders are not called waste. Use approved recipes, verified pack information and representative measurements. No labour, energy, tax, customer demand, food-safety assessment or unentered cost is inferred. Annual savings are not projected.
Your inputs stay in this tab. The calculator does not transmit or store them. Copy summary includes the scenario's assumptions and any hypothetical-example label.
Use the hypothetical example to see the method. Replace every input before treating the output as your own plan. CAD and USD are display choices; costs must already use the selected currency, and the calculator does not perform an exchange-rate conversion.
The copy-summary button includes the scenario label and limitations. A hypothetical example stays identified as hypothetical when you share it. No result is posted for you, and your inputs are neither transmitted nor stored by the calculator.
Follow the 10-gram example all the way through
Keep the example's denominator in view here. The pack cost is divided by usable product, not the weight of the container or an assumed amount recovered from it. For this invented example, CAD 14.40 divided by 3,000 usable grams gives CAD 0.0048 per gram.
| Hypothetical input | Entered value |
|---|---|
| Usable sauce in one pack | 3 kg |
| Cost allocated to that pack | CAD 14.40 |
| Approved target portion | 60 g |
| Measured average portion | 70 g |
| Servings per operating day | 300 |
| Operating days in this month | 26 |
On a small screen, swipe the table to compare columns. Keyboard users can focus the table and use the arrow keys.
Multiply the difference across the service count. Ten extra grams per portion, multiplied by 7,800 portions, gives 78,000 grams, or 78 kilograms. At CAD 0.0048 per gram, that difference carries CAD 374.40 of ingredient cost.
| Hypothetical comparison | Target portion | Measured portion |
|---|---|---|
| Grams per serving | 60 g | 70 g |
| Ingredient cost per serving | CAD 0.2880 | CAD 0.3360 |
| Ingredient cost for 7,800 servings | CAD 2,246.40 | CAD 2,620.80 |
| Complete portions from one 3 kg usable pack | 50 | 42 |
On a small screen, swipe the table to compare columns. Keyboard users can focus the table and use the arrow keys.
The whole-portion count rounds down by design. A pack can provide 42 complete 70-gram portions with a remainder; that remainder is not automatically discarded. Its treatment depends on your approved handling and production arrangements. The monthly cost comparison uses the full ingredient allocation, without pretending that fractional pack consumption is a purchase order.
A cost difference is not a waste measurement
Ask where the extra sauce actually goes. A larger portion may be intentional, requested by a customer or needed for a different dish. A target may also be outdated. The calculator cannot decide which explanation applies, and a number below target does not prove that the kitchen is performing better.
Measure discarded product as a separate stream. US EPA's food-service tools emphasize collecting the amount, type and reason for wasted food. Its restaurant guidance also describes weighing and recording discarded food to inform changes. That supports a useful distinction: portion weight describes what is served, while a waste record describes what is discarded and why.
Keep the two records connected, without merging them. If a service's portions are above target and plate returns also contain sauce, that is a reason to investigate. It does not establish that the entire portion difference became waste, or that serving less would preserve customer satisfaction. A review should include the actual dish and the people preparing and eating it.
Treat lower portions with the same care. Under-serving can make the monthly ingredient allocation look smaller while leaving the meal short of its intended specification. Any change belongs with the person authorized to approve the recipe and service standard. The objective is an explainable portion, with cost and quality considered together.
Check the pack cost before judging the portion
Use a consistent ingredient-cost basis throughout. If your pack figure includes allocated delivery charges, keep that basis for both portions. If it excludes tax, deposits or other charges, understand those exclusions. The calculation allocates the amount you entered; it cannot determine an accounting policy or infer omitted costs.
Make usable weight a deliberate measurement too. Confirm what product can actually be used under your approved procedures, excluding the container and unavailable residue. Do not borrow another kitchen's yield assumption. A smaller usable denominator increases the cost allocated to each gram even when the invoice price is unchanged.
Compare products against their intended application first. Different formulations may not give the same result on the plate at the same weight. This tool compares two portions of the same sauce; it does not validate substitutions, recipes, shelf life or food safety. An apparent portion-cost advantage is incomplete if the product does not suit the dish.
Request the documents for the actual product. Vikmar's foodservice range and quality-document enquiry can help frame that conversation. Confirm the selected sauce, current pack information, specification and commercial terms separately. The example in this article does not establish any product's actual usable fill or price.
Run a small check your team can repeat
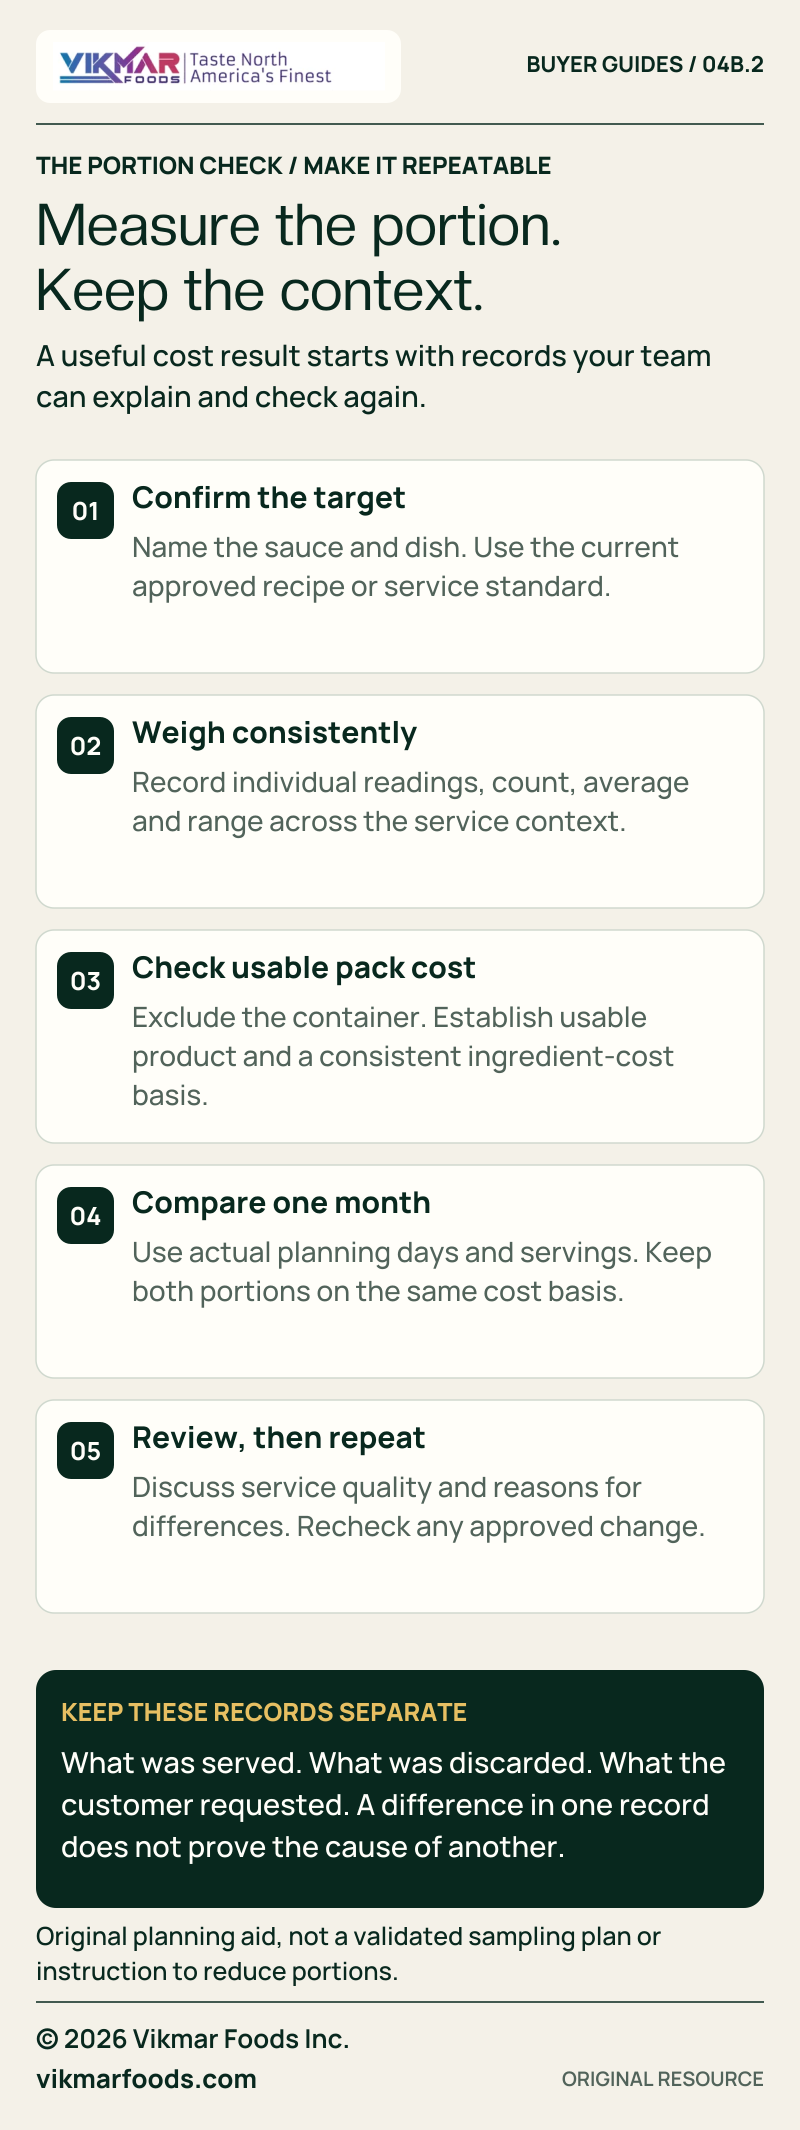
Give the check a defined scope first. Choose one sauce, one dish and an agreed service period, then record the approved target before measuring. Keep the product reference, pack-cost basis and usable-weight method beside the readings so a later review can reproduce the comparison.
Record enough context to explain a change. Useful fields include service date, dish, utensil or dispenser, number of readings, individual weights, average, range and reasons for intentional exceptions. If a guest requests extra sauce, distinguish that order from an unrequested serving difference rather than classifying both as the same problem.
Review the result with the service team. Discuss the measurements and customer experience before choosing an adjustment. If an approved change is made, repeat the check using the same method and comparable service context. A single improved reading is not proof of sustained savings, and the model does not replace actual purchasing and waste records.
Use the formulas without the calculator
The arithmetic is deliberately available for checking:
- Usable grams per pack = usable kilograms × 1,000.
- Ingredient cost per gram = entered pack cost ÷ usable grams.
- Servings this month = servings per operating day × operating days.
- Monthly target cost = target grams × monthly servings × cost per gram.
- Monthly measured-portion cost = measured average grams × monthly servings × cost per gram.
- Monthly cost difference = measured-portion cost − target cost.
Retain precision until the final money display. Rounded per-portion costs multiplied back across thousands of servings can differ from a calculation using the original figures. The tool keeps exact ratios internally, displays money to cents and per-portion costs to four decimals, and rounds complete portions per pack downward.
Keep the planning window to one month. The calculator accepts one to 31 operating days and does not multiply the result into an annual saving. Different months may have different service counts, menus, prices and portion practices. A useful result is specific enough for your team to check against what actually happened.
Make the result worth sharing
Share the assumptions with the interesting number. “Ten grams cost CAD 374.40” leaves out the usable pack cost, service count and month length that created the answer. “In a hypothetical 7,800-serving month, these entered costs produce a CAD 374.40 difference” gives another operator enough context to test the method honestly.
Use the calculator with your own team. Its most useful output may be a question about measurement, product recovery or service consistency rather than a dramatic savings figure. If you need product-specific information to complete the inputs, contact Vikmar Foods with the sauce, pack and application you are considering.
Research and resource notes
The measurement discussion draws on primary US EPA food-service assessment tools, updated March 22, 2026, and its August 2016 restaurant tip sheet. The older sheet is used only for its weighing-and-recording approach, not as current storage or food-safety advice. Research was checked October 21, 2026. The model, example and graphics are original editorial resources, with no invented field trial, interview, measured saving or industry-average portion claim.
© 2026 Vikmar Foods Inc. Attribution is welcome and voluntary when sharing these resources. A link to Vikmar Foods helps readers find their context.
Information-use disclaimer
Information on this website is provided for general informational purposes only and may change. It is not professional advice, a product specification or a quotation. Examples and calculations are illustrative; confirm current product documentation, commercial terms and applicable requirements before acting. You are responsible for assessing suitability for your particular use and seeking qualified advice where needed.
To the extent permitted by applicable law, Vikmar Foods Inc. disclaims liability for losses arising from reliance on this information. This notice does not exclude any rights or liabilities that cannot lawfully be excluded.