
The cheapest oil on your quote sheet may not produce the cheapest portion on your menu. The invoice tells only one story. If another suitable oil requires less fresh oil or less handling to produce the same acceptable output, its higher purchase price can still lead to a lower operating cost.
That is a possibility, not a promise. Your own kitchen supplies the evidence. This guide explains how to compare oils using cost per 100 saleable portions, with a transparent worked example and a trial framework you can adapt to your operation.
The price per litre leaves questions unanswered
A supplier quote measures what you buy. Your fryer measures what you produce. Between those two points sit initial fills, top-ups, discarded oil, filter supplies and the time your team spends looking after the equipment, all of which can change the comparison.
Two oils with identical delivered prices can have different operating costs in a particular kitchen. Equally, the cheaper oil may win. You cannot establish either result from the label alone, because the application, product specification, food mix and operating routine all influence what happens during service.
Three questions for every quote
- Purchase price: What does the oil cost per comparable unit, delivered?
- Oil cost per output: How much fresh oil expenditure supports a defined quantity of acceptable food?
- Operating cost per output: What happens when you add the measured costs of oil handling, filters and used-oil collection?
Keep those questions separate during negotiations. Each measures a different business reality. A lower invoice price is useful, but it does not settle the operating-cost question until you know how much oil and associated work the kitchen actually needs.
Calculate oil operating cost per 100 portions
Use a denominator your kitchen can count. Standard portions make the comparison meaningful. For a restaurant that might mean one defined serving of fries; for a production line with varying pack sizes, kilograms of acceptable finished product may be more useful than portions.
Cost per 100 saleable portions = [(fresh oil used × delivered unit price) + allocated oil-handling labour + filter and related supplies + net used-oil collection cost] ÷ saleable portions × 100.
Define the measurement boundary before collecting numbers. Count fresh oil, not oil purchases. For the simplest trial, record initial fills and every top-up across complete oil-use cycles, beginning with an empty, prepared fryer and ending when that cycle's oil is removed under your established procedure.
Treat your storeroom and fryer as different ledgers. Delivered inventory is not automatically consumed. If an observation window ends with oil still in service, account for that carryover consistently or extend the observation to complete cycles before comparing the results.
Count every portion that meets the agreed specification and is available for sale. Exclude rejected portions from that denominator. Their oil and handling costs remain in the numerator, so poor yield makes the cost per acceptable portion rise rather than quietly disappearing from the calculation.
The inputs to record for both candidates
| Input | What to record | Common comparison error |
|---|---|---|
| Fresh oil | Initial fills and top-ups in one consistent unit | Using cases purchased instead of oil used |
| Delivered unit price | Net oil price plus consistently allocated delivery charges | Comparing litres with pounds or ignoring freight |
| Oil-handling labour | Active time spent on the defined oil tasks, multiplied by one stated labour rate | Counting unattended drain time as staff time |
| Supplies | Measured filter media and other included consumables | Including an item for only one candidate |
| Net collection cost | Collection charges minus actual contractual collection credits | Assuming a rebate that has not been agreed |
| Saleable output | Standardised portions meeting the same food specification | Counting unlike portion sizes as equivalent |
A higher unit price can still produce a lower total
Consider two unnamed candidates in a hypothetical kitchen producing 4,000 saleable portions. These numbers are entirely illustrative inputs. They are not Vikmar product test results, market prices, customer outcomes or evidence that paying more for oil will reduce consumption or labour.
Assume both candidates meet the same food-quality and operating requirements, and each observation covers complete oil-use cycles. All amounts are in Canadian dollars. The labour rate is an illustrative CAD 24 per hour, filter supplies cost CAD 12 per candidate, and net collection cost is assumed to be zero.
| Model input or result | Candidate A | Candidate B |
|---|---|---|
| Delivered oil price per litre | CAD 2.00 | CAD 2.20 |
| Fresh oil used | 100 L | 85 L |
| Oil expenditure | CAD 200.00 | CAD 187.00 |
| Active oil-handling time | 1.5 hours | 1.0 hour |
| Allocated labour cost | CAD 36.00 | CAD 24.00 |
| Filter supplies | CAD 12.00 | CAD 12.00 |
| Net collection cost | CAD 0.00 | CAD 0.00 |
| Total included operating cost | CAD 248.00 | CAD 223.00 |
| Saleable standardised portions | 4,000 | 4,000 |
| Cost per 100 portions | CAD 6.20 | CAD 5.58 |
Candidate B has a 10% higher oil price, yet its modelled total is CAD 25 lower. The assumptions create that result here. A 15-litre reduction in fresh oil and half an hour less allocated handling time outweigh the higher price, producing a 10.1% reduction in the included operating cost.
Keep the distinction between resource cost and cash savings visible. Staff time is not always cash. If paid hours do not change, the model's CAD 12 labour difference represents time available for other work rather than an automatic reduction in the payroll bill.
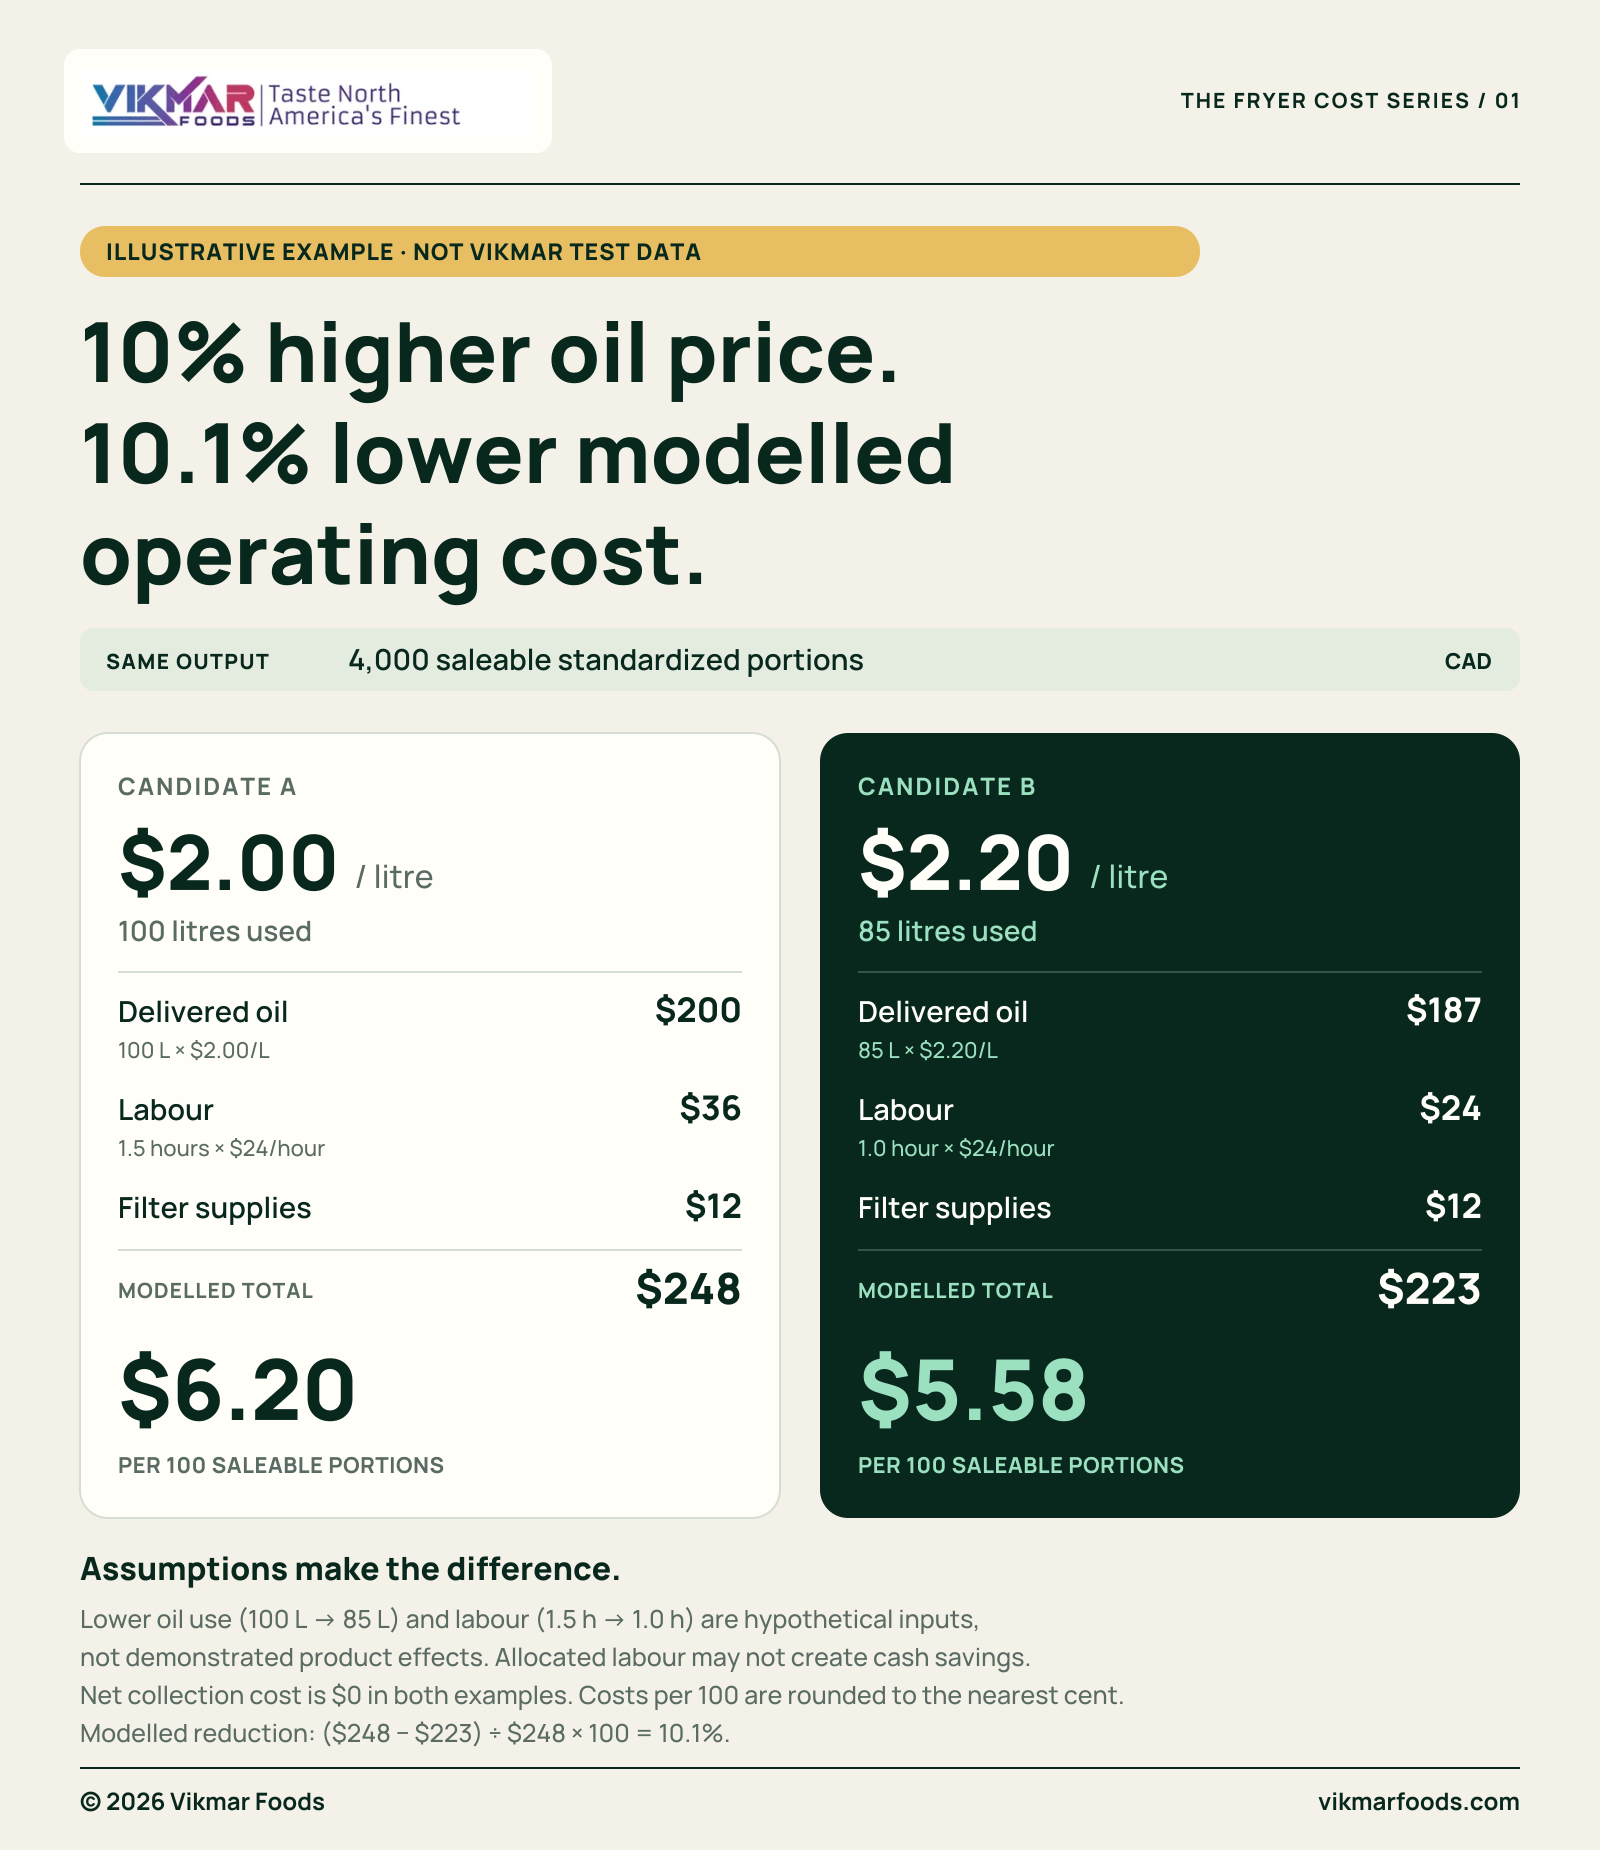
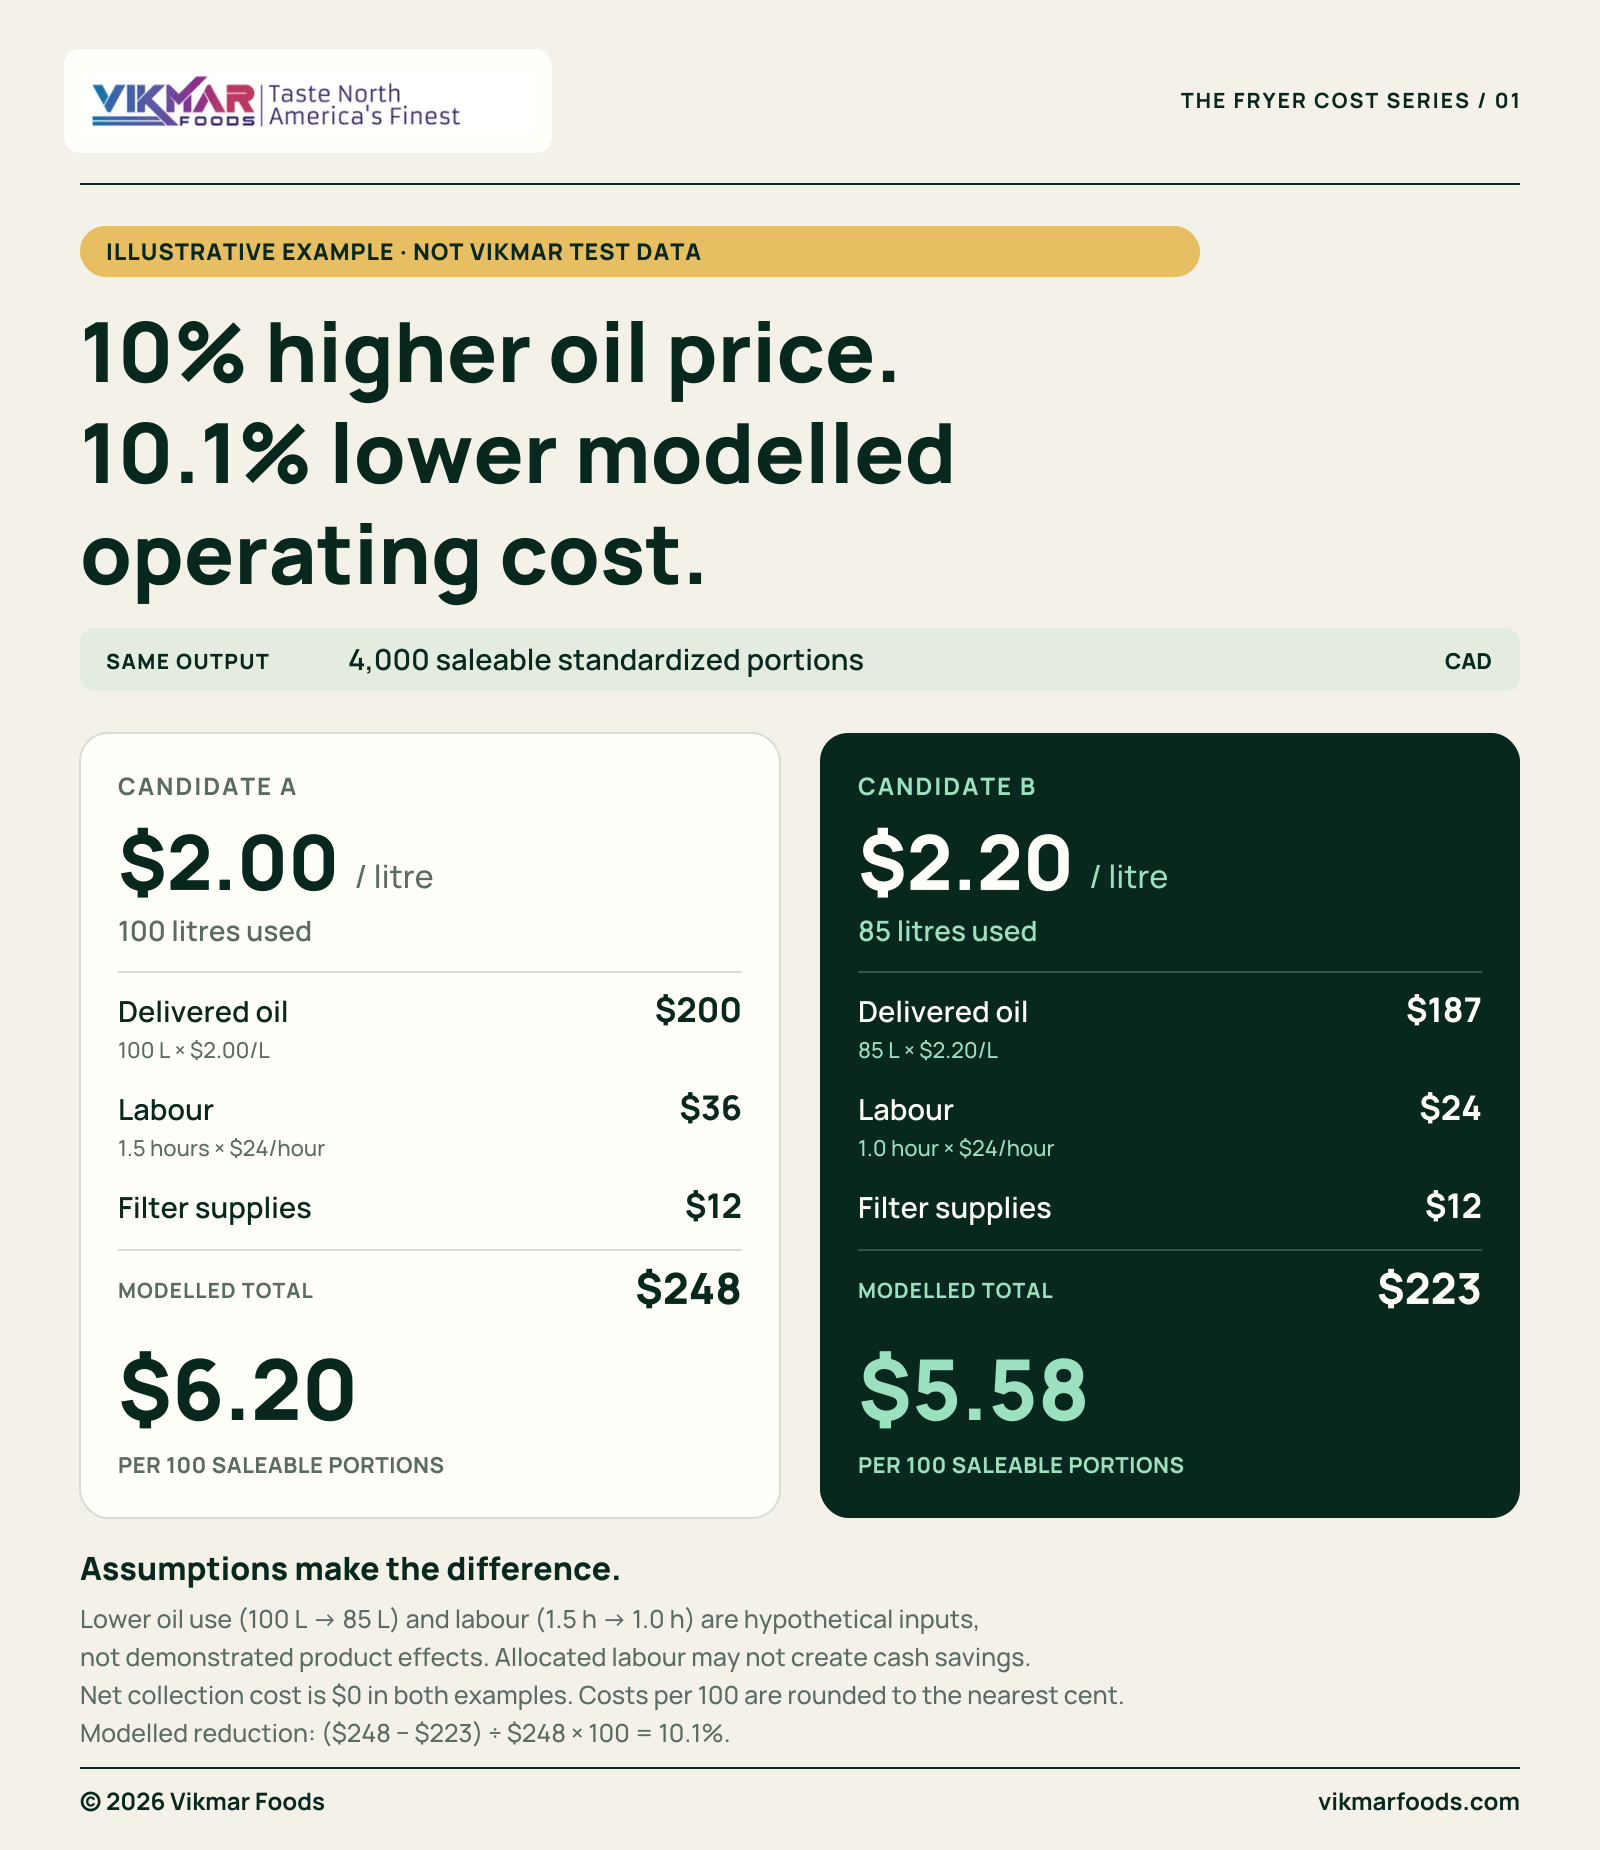
Original illustration by Vikmar Foods. Hypothetical inputs; not a product performance claim. Per-portion figures are rounded only after calculation. Credit: Vikmar Foods.
Find the point where the premium stops paying
The most useful number may be the break-even quantity. It makes the purchasing decision testable. Holding Candidate B's labour, supplies and collection assumptions fixed, divide the cost remaining after those items by its delivered oil price to find the maximum oil quantity that matches Candidate A.
Candidate B break-even oil use = (CAD 248 − CAD 24 − CAD 12 − CAD 0) ÷ CAD 2.20 per litre = approximately 96.36 litres.
Candidate B must use less than roughly 96.36 litres to beat A within this particular operating-cost model. Change the assumptions and that changes. If you compare oil expenditure alone, B must use less than approximately 90.91 litres, calculated as CAD 200 divided by CAD 2.20 per litre.
| Candidate B fresh oil use | Total modelled cost | Cost per 100 portions | Difference from Candidate A |
|---|---|---|---|
| 85 L | CAD 223.00 | CAD 5.58 | CAD 25 lower |
| 95 L | CAD 245.00 | CAD 6.13 | CAD 3 lower |
| 100 L | CAD 256.00 | CAD 6.40 | CAD 8 higher |
A narrow apparent saving deserves another look. Small differences can reverse the ranking. At 95 litres, just CAD 3 separates the candidates, so modest differences in measured labour, delivery charges or actual portions could change the purchasing decision.
Use the companion calculator to replace the example inputs with your own measurements, keeping the same units, output definition and cost boundary for both candidates. Treat the result as decision support. It cannot establish whether an oil is suitable, safe or better for your application without the corresponding product and kitchen evidence.
Put your own numbers to work
Compare cost per 100 portions
Starts with the article's hypothetical example. Enter measured figures using the same output definition and complete-cycle boundary for both candidates. All costs are CAD; quantity is litres. Inputs stay in this page and are not saved or sent.
Includes oil, allocated handling labour, supplies and net collection cost. Excludes energy, equipment, tax and food ingredients. Allocated labour differences may not be cash savings. Food quality and discard requirements apply independently of cost.
Why your kitchen needs its own evidence
Frying oil changes while it works. Heat, oxygen and moisture all matter. AOCS technical guidance describes oxidation, hydrolysis and other reactions during frying, alongside interacting variables such as food type, operating conditions and the oil itself, which make universal performance claims unreliable.
The food changes the trial too. A menu switch changes the comparison. Original frying research published in the Journal of Food Science examined different foods and found that the food being fried influenced oil degradation, reinforcing why your test should document the actual menu and preparation conditions.
Smoke point cannot answer the whole purchasing question. One temperature cannot describe an operation. A comparison also needs to consider flavour, food quality, oil condition over use, handling requirements and the amount of acceptable output produced under your established operating procedure.
Filtration deserves a precise description in the discussion. Clearer oil is not new oil. Food-science guidance distinguishes particle-removing filtration from treatments aimed at dissolved degradation compounds, so removing crumbs should not be presented as proof that every chemical change has been reversed.
Good evidence starts with defined quality and discard rules. Set those rules before testing begins. Use the requirements applicable to your operation and the relevant equipment, product and food-safety guidance; a favourable cost calculation never justifies using oil beyond those established limits.
Run a fair comparison in six steps
1 Set the acceptance rules
Define what an acceptable portion looks and tastes like before opening either candidate. Keep the decision rules in writing. Record the required serving weight, appearance, flavour, holding performance and applicable oil-condition checks, so the team does not unconsciously move the goalposts after seeing the price.
2 Match the working conditions
Give each candidate a comparable job. Keep the major operating conditions consistent. Match the fryer or comparable equipment, fill level, temperature procedure, batch loading, food preparation, food mix and filtering routine, and record differences that cannot reasonably be eliminated during normal service.
3 Keep a simple operating log
Record events when they actually happen. Memory becomes fuzzy after busy service. Log fills, top-ups, active handling minutes, filter changes, acceptable output and the reason each oil cycle ended, rather than asking the closing team to reconstruct the day from a pile of empty containers.
4 Calculate using complete observations
Compare like with like at the calculation stage. Keep the accounting boundaries consistent throughout. Use complete cycles where practical, total the fresh oil and included costs, and divide by the same definition of acceptable output, while noting any excluded costs or estimated entries alongside the result.
5 Repeat before choosing a winner
One unusual service can distort the picture. A second observation adds useful context. Repeat across comparable operating conditions and, where practical, alternate the order of the candidates so a menu change, different crew or unusually quiet service is less likely to decide the outcome unnoticed.
6 Make a purchasing decision the kitchen can support
Choose the candidate that meets your requirements at a defensible total cost. Quality remains part of that decision. Review the variation between observations, delivery suitability, documentation, packaging and supply arrangements alongside the cost calculation, especially when the apparent difference is too small to survive normal operating variation.
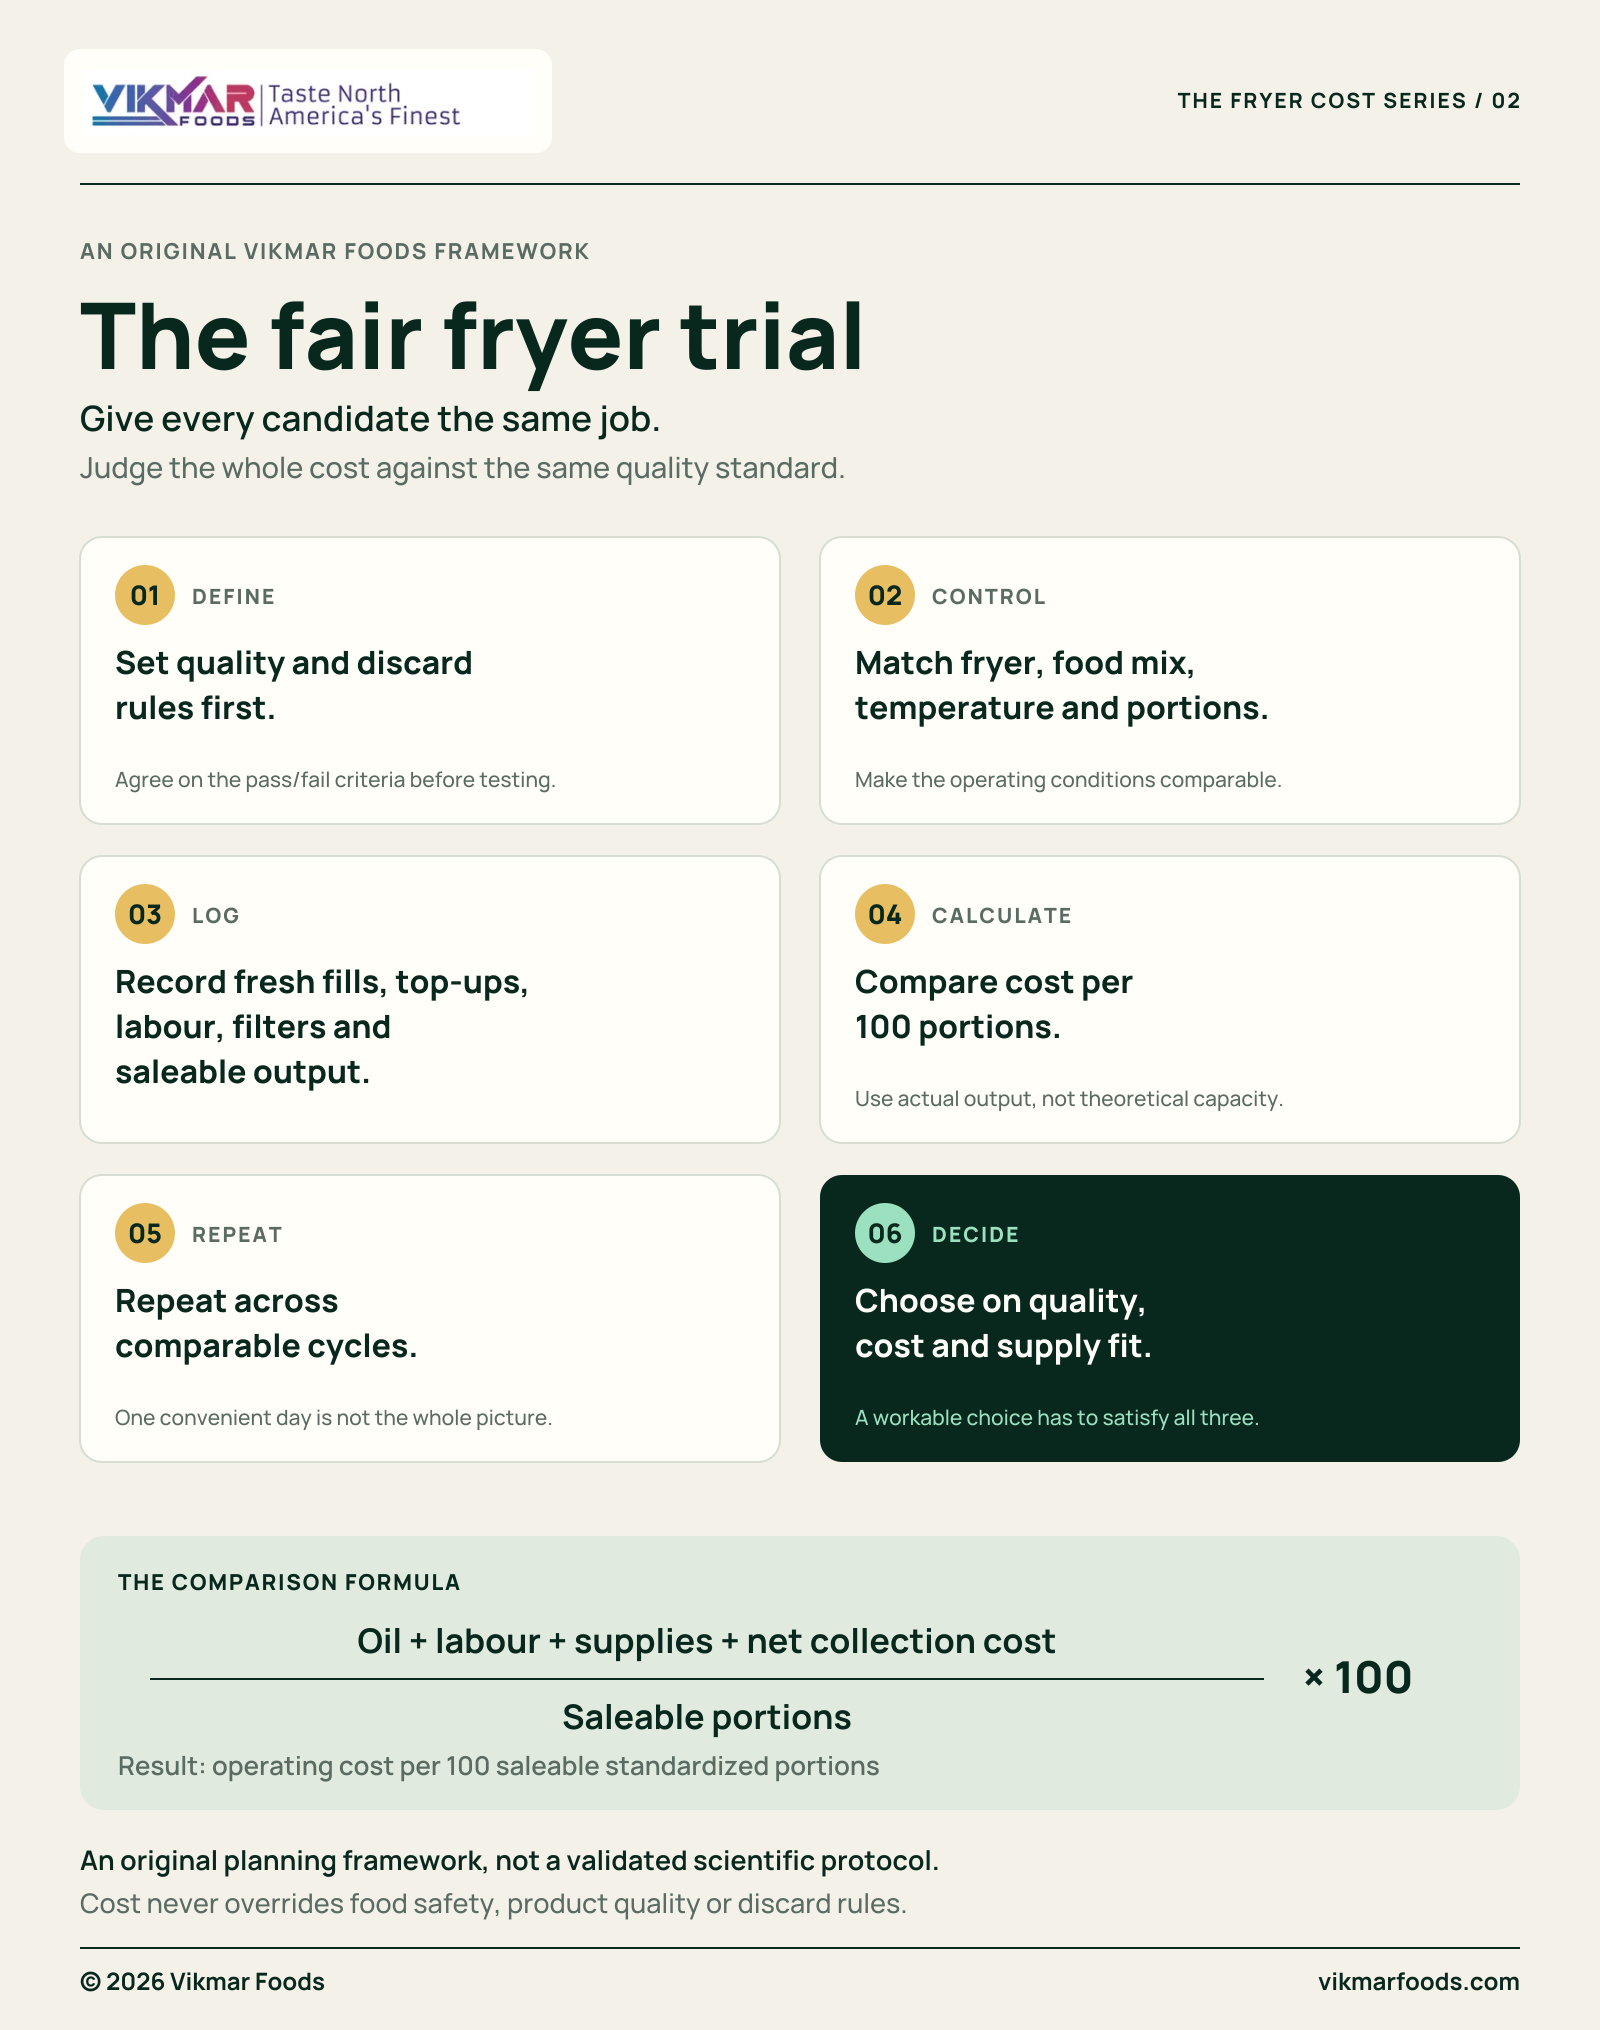
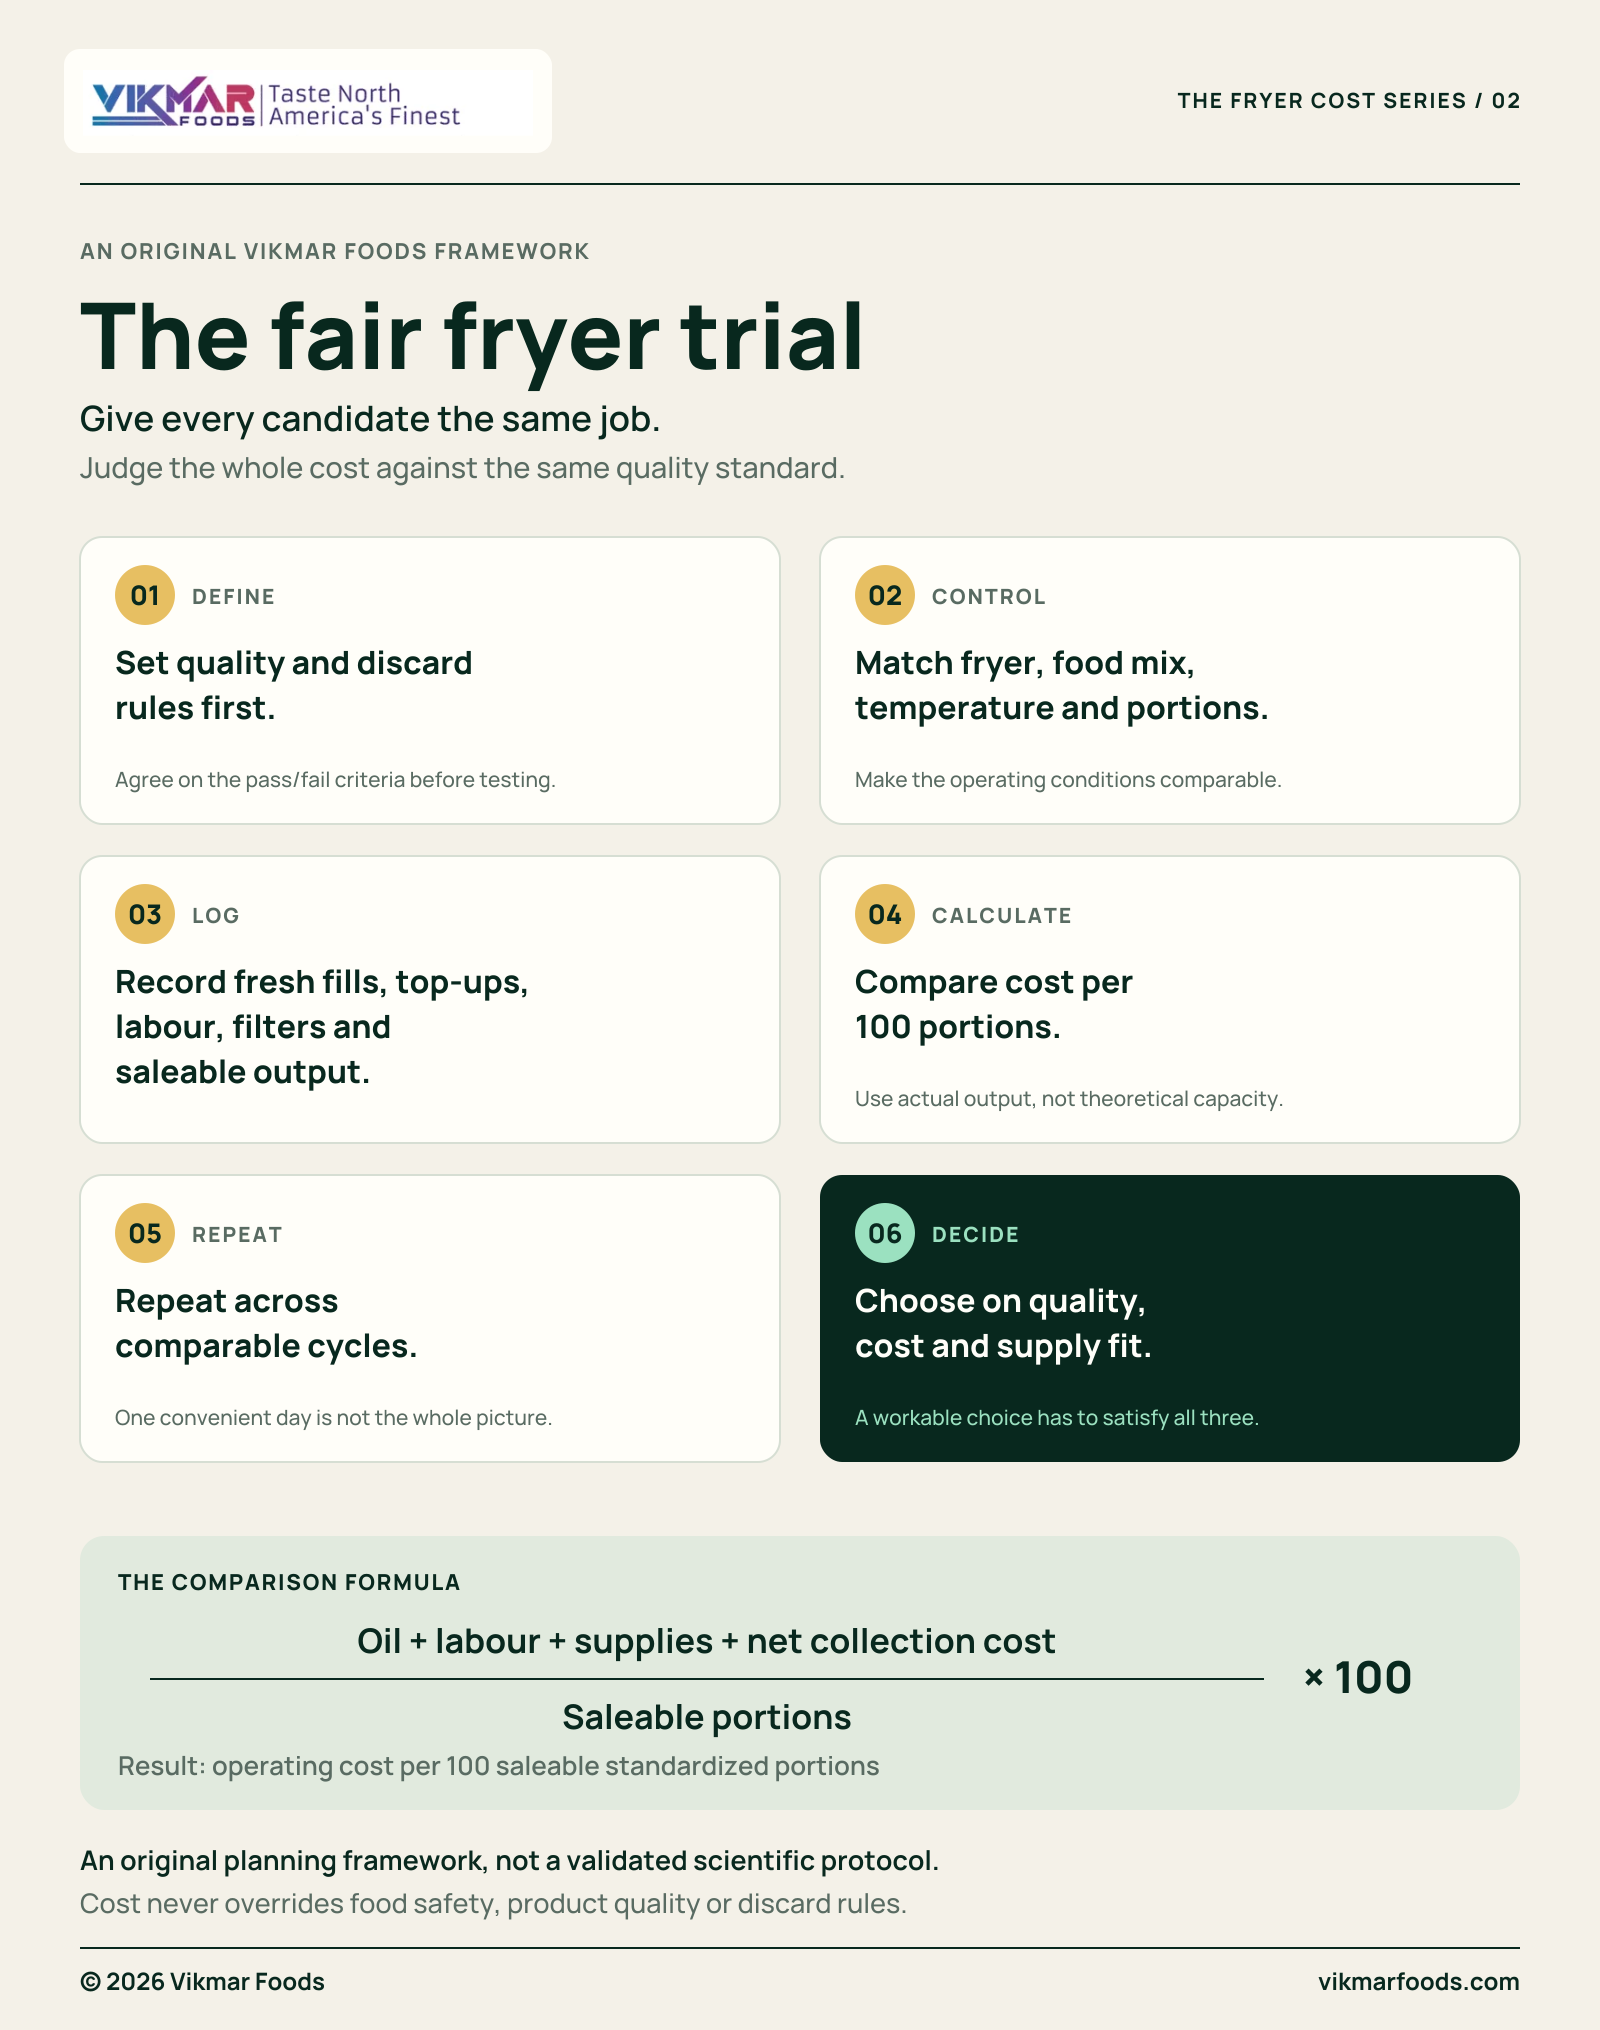
An original Vikmar Foods purchasing framework. Adapt it to your operation; it is not a validated laboratory protocol. Credit: Vikmar Foods.
Copy this log for your next comparison
A useful worksheet should survive a busy shift. Keep the recording burden reasonably small. Put the following fields into your existing kitchen log or purchasing worksheet, with one record per defined observation and separate event entries when fills, top-ups or filter changes occur.
| Field | Your entry |
|---|---|
| Candidate, product specification and lot | ____________________ |
| Fryer identification and observation dates | ____________________ |
| Food mix and standard portion definition | ____________________ |
| Temperature, loading and filtering procedure | ____________________ |
| Acceptance checks and oil-cycle end reason | ____________________ |
| Initial fills and top-ups, with unit | ____________________ |
| Delivered price in the same unit | ____________________ |
| Active handling minutes and labour rate | ____________________ |
| Supplies and net collection cost | ____________________ |
| Saleable output and rejected portions | ____________________ |
| In-use oil carryover or boundary adjustment | ____________________ |
| Unusual events, estimates and excluded costs | ____________________ |
Ask a better question when requesting quotes
Ask suppliers for a comparison your operation can use. Give them the application details first. Describe the food, fryer, volume, desired packaging and delivery needs, then request the relevant specification and handling information instead of expecting a price-only quote to resolve the whole decision.
Pack size deserves its own line in that conversation. Bigger packs do not automatically win. Include the practical realities of receiving, storage, transfer equipment and handling when comparing jug-in-box, drum or bulk options, and verify net quantity rather than treating a package's nominal capacity as the amount purchased.
Keep mass and volume comparisons on a consistent basis. Litres and kilograms are different units. When a conversion is needed, use an appropriate supplier-supported density and its stated conditions, rather than silently assuming that one litre of edible oil weighs one kilogram.
Vikmar Foods supplies cooking oils and food ingredients for foodservice, retail and industrial buyers. Start with your actual operating needs. Explore the product range, review bulk and packaging options, or contact Vikmar Foods to discuss a product and pack format for your application.
What this calculation does and does not establish
This is a deliberately bounded operating-cost comparison. It is not a profitability forecast. The example excludes energy, equipment depreciation, tax treatment, financing, food ingredients and lost sales; include additional measured costs consistently if they materially differ between the alternatives you are evaluating.
A good buying decision needs both numbers and judgement. Your records make that judgement stronger. Use a repeatable comparison to identify which suitable oil works best in your kitchen, and let the observed cost per acceptable portion inform the next order alongside quality and supply requirements.
Research and illustration notes
The numerical model and purchasing framework are original Vikmar Foods editorial examples; no laboratory testing or customer study was conducted for this article. Technical background draws on the following sources:
- AOCS, Enhancing oxidative stability and shelf life of frying oils with antioxidants, September 2018.
- AOCS Lipid Library, Oil Refining, undated.
- Institute of Food Technologists, Ensuring Quality and Safety in Fried Foods, February 6, 2024.
- Flores-Álvarez and colleagues, The effect of food type (fish nuggets or French fries) on oil blend degradation during repeated frying, Journal of Food Science, November 2012. The indexed abstract supports the limited food-type observation discussed here.
Share the graphics with credit
If you reference these graphics or calculations, please credit Vikmar Foods and link to the original article so readers can find the context behind the example. Keep the example labels attached. Suggested attribution: “Source: Vikmar Foods, Why the Cheapest Frying Oil Can Cost More per 100 Portions, September 30, 2026.”
© 2026 Vikmar Foods Inc. Original article, graphics and purchasing framework.